 This is a visualization of a research about the topic shift of a pool of documents over a period from 1996 to 2006. It has the stem words which are parsed from the abstracts and the years which the words are related to. It is designed to have years as hubs around the center and the words are linked to corresponding years. Terms which occur in several years are placed at the center. From this visualization, we can easily see which kind of topics have occurred in several years, as well as the kinds of topics which shift from year to year.
Saturday, June 4, 2011
This is a visualization of a research about the topic shift of a pool of documents over a period from 1996 to 2006. It has the stem words which are parsed from the abstracts and the years which the words are related to. It is designed to have years as hubs around the center and the words are linked to corresponding years. Terms which occur in several years are placed at the center. From this visualization, we can easily see which kind of topics have occurred in several years, as well as the kinds of topics which shift from year to year.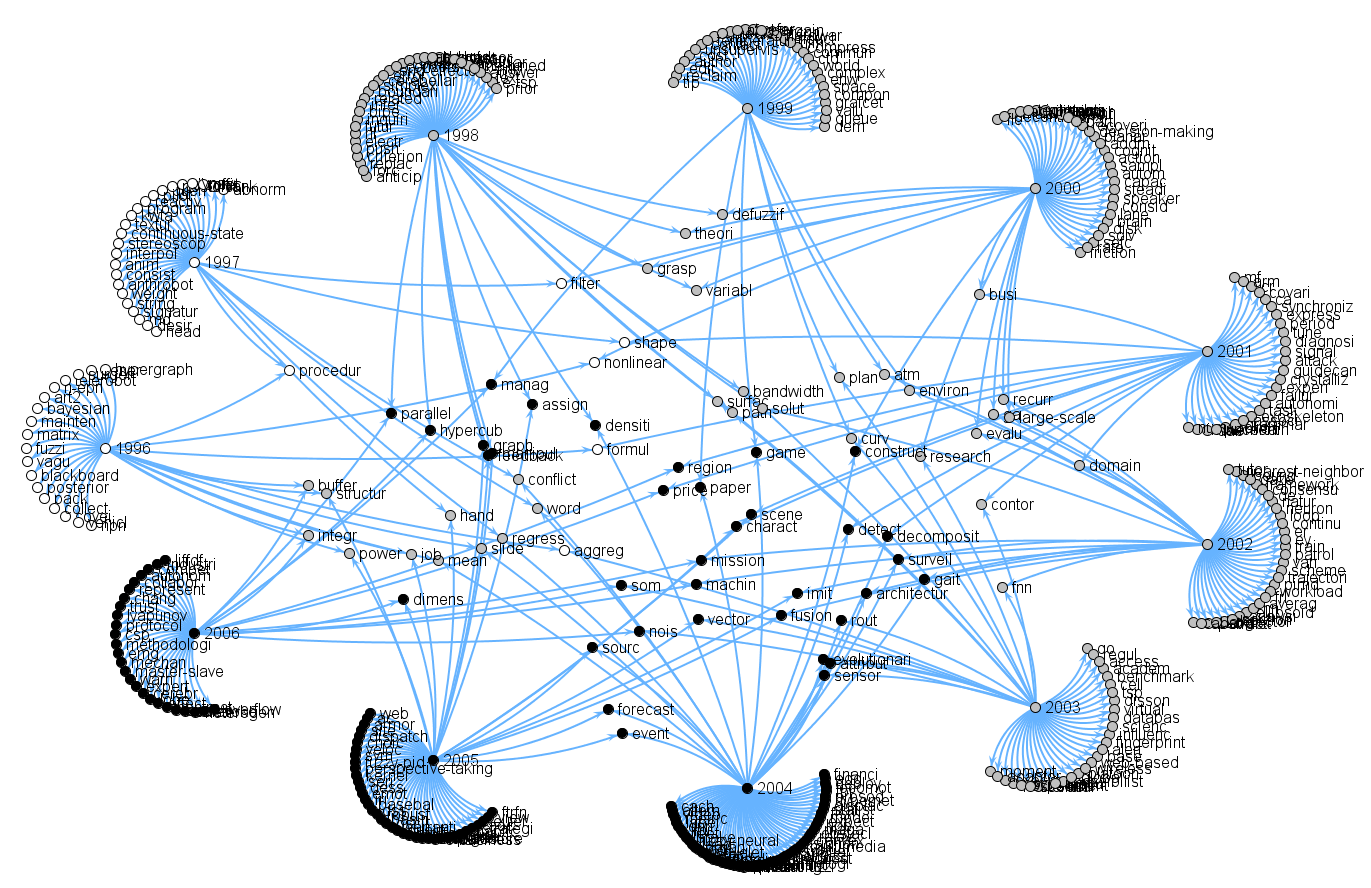
Subscribe to:
Post Comments (Atom)
No comments:
Post a Comment